
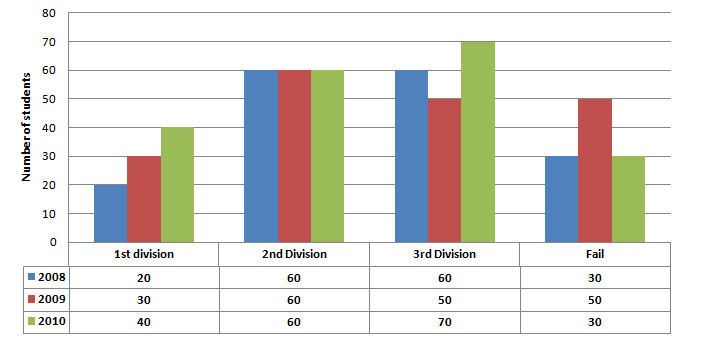
Directions: The sub divided bar diagram given below depicts H.S. Students of a school for three years. Study the diagram and answer the questions.
Question 1: The percentage passed in 1st division in 2008 was
(1) 27%
(2) 32%
(1) 27%
(2) 32%
(3) 153/8%
(4) 1113/17%
Question 2: The pass percentage in 2008 was
(1) 67%
(2) 73%
(1) 67%
(2) 73%
(3) 792/3%
(4) 826/17%
Question 3: In which year the school had the best result for H.S. in respect of percentage of pass candidates ?
(1) 2008
(2) 2009
(3) 2010
(4) The percentage of pass candidates are same for the three years.
(1) 2008
(2) 2009
(3) 2010
(4) The percentage of pass candidates are same for the three years.
Question 4: The number of students passed in third division in the year 2008 was
(1) 50
(2) 60
(3) 70
(4) 80
(1) 50
(2) 60
(3) 70
(4) 80
Question 5: The percentage of the students passed in 2nd division in the year 2010 was
(1) 30%
(2) 40%
(3) 50%
(4) 60%
(1) 30%
(2) 40%
(3) 50%
(4) 60%

Directions: The graph given here shows a car following the linear path with uniforms speed. Study the graph and answer the questions.

Question 1: The speed of the car is
(a) 12 km/hr
(b) 6 km/hr
(c) 18 km/hr
(d) 24 km/hr
(a) 12 km/hr
(b) 6 km/hr
(c) 18 km/hr
(d) 24 km/hr
Question 2: The speed of the car in metres per minute is
(a) 60
(b) 100
(c) 600
(d) 1000
(a) 60
(b) 100
(c) 600
(d) 1000
Question 3: The distance travelled by the car in 4.5 hours is
(a) 27 km
(b) 30 km
(c) 36 km
(d) 40 km
(a) 27 km
(b) 30 km
(c) 36 km
(d) 40 km
Question 4: The car covers a distance of 15 kilometers in
(a) 3 hours
(b) 2 hours
(c) 1.5 hours
(d) 2.5 hours
(a) 3 hours
(b) 2 hours
(c) 1.5 hours
(d) 2.5 hours


No comments:
Post a Comment